The Lopez Impulse indicator is a unique tool that calculates volatility and price directional movement simultaneously to identify the true price breakouts and eliminate any indecisive and sudden price fluctuations which are often mistaken for a breakout. As a result, this indicator could be extremely helpful in your trading journey by better understanding market movements and avoiding false breakouts
How the Lopez Impulse Indicator Works
The Lopez Impulse indicator is based on the concepts of support and resistance, which are key elements in identifying breakout points. This indicator combines these two concepts with an additional calculation measuring the strength or weakness of current market momentum. Momentum is measured using the Average Directional Index (ADX), which is a common technical analysis tool. By taking all of these calculations into consideration, the Lopez Impulse Indicator is able to more accurately pinpoint potential breakout points. In addition, this indicator also takes into account sudden and sharp price changes that might otherwise be mistaken as a breakout but are actually just part of market noise. By understanding and accounting for all of these different aspects, the Lopez Impulse Indicator can help you become a more successful trader.
How to Use the Lopez Impulse Indicator
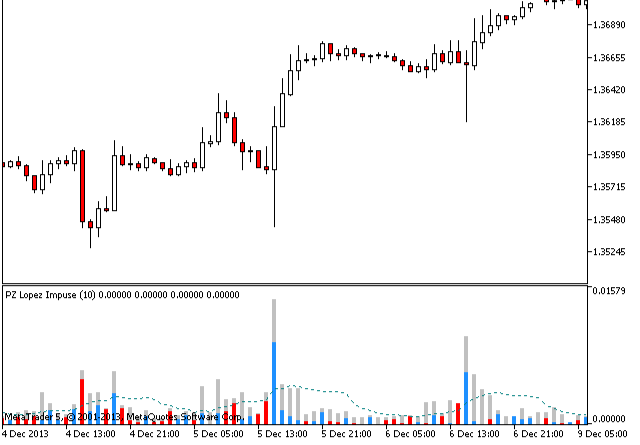
The blue and red histograms represent the bullish and bearish impulses respectively. While the gray histogram projects the current volatility and the blue dotted moving average is the average volatility.
When the bullish impulse exceeds the average volatility you can expect the pair to appreciate. While when the bearish impulse exceeds the average volatility you could expect the bears to take over.
It’s worth noting that the indicator has alerts implemented and it does not repaint or backpaint.
Here are some quick tips on how to use the Lopez Impulse indicator:
-If you see a green histogram that exceeds the blue dotted moving average, that’s a signal to go long on the currency pair
-If you see a red histogram that exceeds the blue dotted moving average, that’s a signal to go short on the currency pair
-If you see a gray histogram that exceeds both red and blue histograms, that’s a signal that there is increased volatility in the market and you should be cautious with your trades
-You can use support and resistance levels to confirm your trade signals. For example, if you see a green histogram but price is struggling to break through a major resistance level, hold off on entering your trade until price gives you a confirmed breakout signal.
Conclusion
The Lopez Impulse indicator is a powerful tool for Forex traders who are looking for an edge in their trading. By monitoring four key components of market activity, the indicator can help you make better-informed trading decisions. Use it in conjunction with other technical indicators and chart patterns for even greater success.